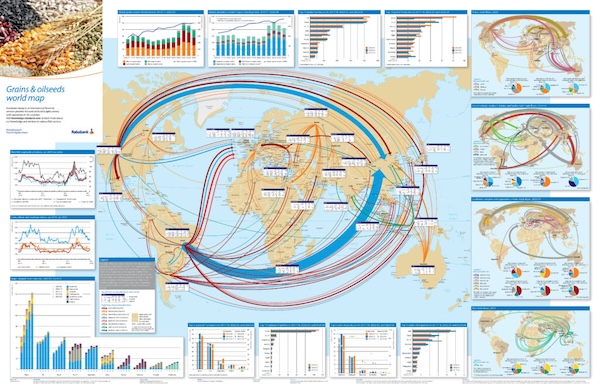
Rabobank is out with the sixth edition of its “Grains and Oilseeds World Map,” which shows that trade has continued to grow despite global upheaval. Trade volumes have increased by a compound annual growth rate (CAGR) of +3.2% for grains and +2.4% for oilseeds, based on data analyzed from 2018/19 to 2023/24. Rabobank does note that this is a slower pace compared to the +7% CAGR seen in the previous decade. Overall global grains and oilseeds trade reached nearly 880 million metric tons (MMT) in 23/24, with an estimated value of $330 billion.
Wheat is the Most Traded Grain, but Highly Fragmented – Wheat is the most traded grain globally, with an average of 216 MMT traded annually between 2021 and 2023. “Overall, the wheat market is highly fragmented when it comes to production, imports and exports, and the number of players,” explains Vito Martielli, Senior Analyst – Grains and Oilseeds for RaboResearch. Russia has emerged as the world’s leading wheat exporter, significantly outpacing its competitors. Among the top importers, Egypt remains the largest wheat importer in Africa; Turkey is increasingly serving as a hub for wheat imports and re-exports; and China has increased its imports due to a rise in domestic consumption over the past five years.
Corn is Second Globally, Still King in US – Corn is the second most traded grain globally, with an average of 193 MMT traded annually between 21/22 and 23/24. Unlike wheat, corn production and exports are highly concentrated in four countries – the US, Brazil, Argentina, and Ukraine – which together account for 90% of global corn trade. The U.S. is still the top corn exporter but Brazil is catching up. Brazilian exports have grown at an +11% CAGR since 2001-02 compared to +1% for the U.S. The top 10 importers have shifted since 2003 with emerging markets increasing their share, now accounting for 70% of corn imports. Developed countries make up 30%. In Rabobank’s first map, the split was 55% for emerging markets and 45% for developed.
Soybeans Not Widely Produced Where They are Consumed – Soybeans are the most traded oilseeds globally – with an average of 168 MMT traded annually between 2021 and 2023 – and Rabobank points out that they are not widely produced in the countries that are the biggest buyers. Production is concentrated in Brazil, the U.S. and few other countries in South America, while Asia and EU are the biggest importers globally. “Developed countries such as those in the EU and Japan – which were the largest importers in 2002 – are now experiencing negative import growth, driven by dietary changes and a decline in animal protein consumption,” according to Martielli. “China has emerged as the key driving force in the global soybean trade and crushing industry, reporting exponential growth in both consumption and imports. Brazil has become the largest producer and exporter globally.”
Future Trade Flows – In the next decade, multiple factors are expected to influence global grains and oilseeds trade flows, Rabobank says. On the demand side, the growing population in Sub-Saharan Africa is expected to drive increased wheat imports, while China may experience a slowdown – or even a decline – in soybean imports, according to the report. “At the same time, the retreat from post-Cold War WTO trade norms, rising geopolitical tensions, and a shift toward a more multipolar world are contributing to global instability, which could hinder consistent trade expansion,” Rabobank said. Changes in biofuel policies are likely to affect oilseed crushing dynamics, and the implementation of the EU Deforestation Regulation (EUDR) is already reshaping traders’ business models, it says. Additionally, changing weather patterns can have a significant impact on crop yields and price volatility. A shifting climate may also create new opportunities for a broader range of countries to participate in grain and oilseed trade as production becomes less predictable.