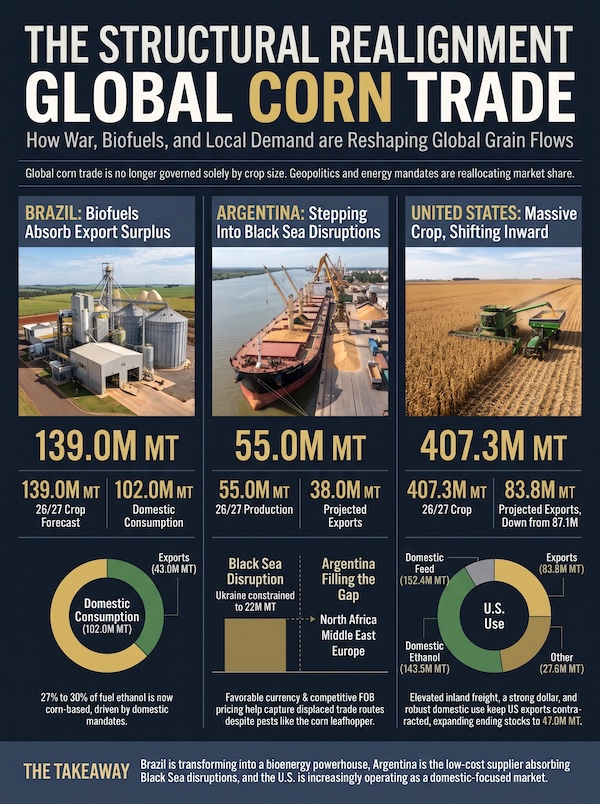



The traditional architecture of global grain trade is undergoing a structural realignment. A combination of ongoing war in the Black Sea, expanding bioenergy mandates in South America, and shifting price dynamics among major producers has fundamentally altered traditional trade flows. These factors are actively reallocating export market share and internal supply priorities across the world’s primary growing regions.
Brazil: Domestic Biofuel Demand Absorbs Export Surplus – Brazil remains a primary global corn power, with its 26/27 crop forecast at 139.00 million metric tons. However, internal market dynamics have shifted drastically. Brazil’s total domestic corn consumption is projected to reach 102.00 million metric tons in 26/27, up significantly from 92.50 million metric tons in 2024/25. This demand surge is anchored by Brazil’s corn ethanol industry, which now generates roughly 27% to 30% of the nation’s total fuel ethanol output. Driven by higher domestic blend requirements and attractive processing margins, Brazilian crushers offer a stable internal market that competes directly with export ports. Consequently, while Brazil’s 2026/27 exports are projected at 43.00 million metric tons, internal industrial processing creates a structural demand floor that limits raw grain export availability during supply contractions.
Argentina: Leaning In to Supply Disrupted Buyers -As Black Sea export routes face ongoing security hazards, high shipping insurance, and logistical delays, Ukrainian exports are constrained at around 22.00 million metric tons for both 25/26 and 26/27. That has left importers across North Africa, the Middle East, and Southern Europe looking elsewhere to secure reliable supplies. Argentina has been the primary beneficiary of this displacement. Favorable currency exchange rates and competitive FOB pricing have allowed Argentine grain to undercut competitors and capture key Atlantic and Asian trade routes. Argentina’s production is estimated at 55.00 million metric tons for 2026/27, supporting projected exports of 38.00 million metric tons. That’s a decline from 25/26 production of 64 MMT and exports of 45 MMT, but that’s not because farmers cut back. Instead, it is mostly the result of late season issues with corn leafhopper during 25/26, which lead to corn stunt disease. And it remains substantially higher than 24/25 production of 49 MMT and 29.07 MMT in exports.
The United States: Large Harvest, Contracted Export Share – Despite producing a massive 16.034 billion bushels (407.28 million metric tons) in 2026/27, the United States has not translated its abundant crop into dramatic export growth. U.S. corn exports are projected to decline to 3.300 billion bushels (83.82 million metric tons) in 2026/27, down from 3.429 billion bushels (87.11 million metric tons) the previous season. Instead, U.S. production is being absorbed internally. Total domestic use is projected at 13.005 billion bushels, with feed and residual use taking 6.000 billion bushels and domestic ethanol processing utilizing 5.650 billion bushels. Strong domestic demand, combined with elevated inland freight costs and a strong U.S. dollar, has kept U.S. export offers less competitive relative to South American origins. As a result, U.S. ending stocks are expanding to 1.849 billion bushels, pushing average season farm prices down to $4.70 per bushel.
Bottom line, global corn trade is no longer governed simply by which nation harvests the largest crop. Brazil is transforming into an integrated bioenergy powerhouse, Argentina is serving as the low-cost supplier absorbing Black Sea disruptions, and the U.S. is increasingly operating as a domestic-focused market. These shifts demonstrate that energy policy and regional freight pricing are now as influential as total acreage in determining global grain distribution.