
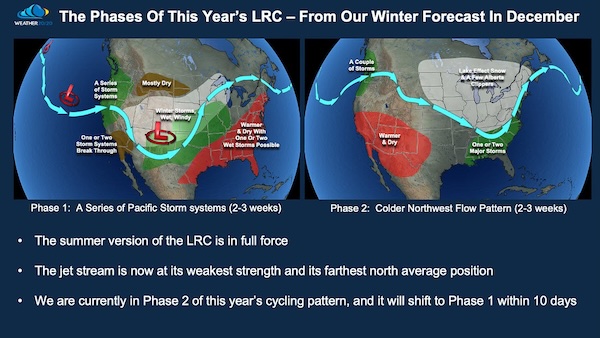
As we move deeper into August, the long-range forecast becomes more critical for planning the weeks ahead. In agriculture, timing is everything, and this update is all about how the evolving weather pattern will shape harvest progress. We just moved out of Phase 2 and are now back in Phase 1 of the LRC for the 8th time since the pattern evolved in October, the wetter version of this year’s cycle, but August often brings some summer twists, bursts of heat, nighttime MCS events, and even tropical influences. One of those influences, Tropical Storm Erin, is tracking directly across the forecast zone we issued back in March for the mid-August LRC segment. It’s a timely example of the pattern working right on schedule.
The bigger story, however, is what happens next. About 34 days from now, this very same segment of the LRC will recycle, between September 20 and October 5, just as the jet stream strengthens and harvest is ramping up. This window has consistently been our wettest and stormiest part of Phase 1 this year, and it could bring challenges to field access, dry-down, and harvest speed. When you read the harvest outlook in this report, it’s not based on seasonal guesses or analog years, it’s rooted in the same pattern analysis that just placed a tropical system in the right place, at the right time, 10 months in advance. We are increasingly confident in the LRC model’s forecast that this year’s pattern will end on a wet note. This is a sharp contrast to late September and October a year ago, when conditions were turning much drier.
Phase 1 of this year’s cycling pattern is set to return in the last third of September through early October, just before the new LRC sets up. Historically this year, Phase 1 has been notably wet across Kansas, Missouri, and Iowa, while much drier over the northern Plains around Fargo. For comparison, Fargo has seen more precipitation during Phase 2 of the pattern this year, and that wetter Phase 2 segment will return in the first half of September, before Phase 1 cycles back through as we can see on this next slide.

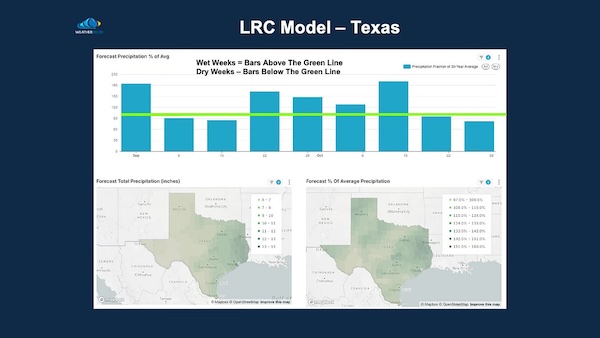
The chart above highlights just how differently the two primary phases of this year’s LRC have performed in terms of precipitation. For harvest planning, the timing of each phase is key:
Phase 1: August 14 – September 5 and September 24 – October 5
In the 2024-2025 season it has been wetter for Kansas City, Missouri, and Iowa. This is the phase that will return during the final third of September — right in the middle of early harvest for many producers.
Phase 2: Just ending now, and September 6 – September 23
Wetter in the northern Plains, including Fargo, but generally drier to the south.

This timing means the first half of September could bring a more favorable harvest timing in the central/southern Corn Belt, while the late September to early October Phase 1 window carries a much higher risk for widespread delays and wet fields, especially in the south-central Midwest.
As consistent as the wet phase has been in this year’s LRC pattern, there have been stretches where it appeared drought conditions were ready to expand. In each case, that drying trend was stopped as a well-timed storm system arrived to replenish soil moisture. Over the next 10 days, that pattern will be put to the test again. The upcoming window will determine whether the wet bias of Phase 1 can continue to hold, or if the dry pockets start gaining ground. The following two slides show projected 15-day rainfall totals from the GFS (American) and European AI models.


Now, let’s take a look at the patent-pending LRC model solutions. These forecasts are generated by blending data from the past few cycles and projecting forward, capturing the unique rhythm of this year’s pattern.Unlike traditional seasonal outlooks, the LRC model pinpoints when and where key storm systems are most likely to occur, and adjusts for seasonal shifts in temperature and precipitation. In this section, we’ll not only examine upcoming precipitation trends, but we’ll also take a closer look at low temperature forecasts across one key state, projected all the way through next winter. This gives us a true, long-range operational tool, from late summer harvest impacts to the first hard freezes of the cold season.

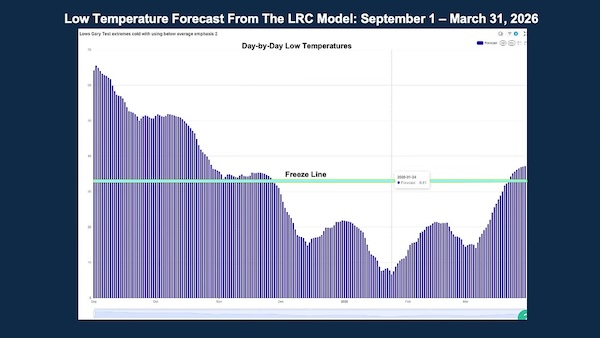
These first two charts show the forecast for the entire state of Iowa. We are currently testing a new low temperature forecast algorithm generated by the LRC model. Below, you’ll see the day-by-day projected low temperatures for Iowa from September 1, 2024, through March 31, 2026. The coldest temperature in this current projection appears on January 24, 2026. It’s important to note that this forecast is based on this past year’s LRC pattern. Once the new LRC pattern establishes itself in October and November, these temperature projections will likely change significantly. For now, this serves as a valuable long-range test of the model’s capabilities, and an early look at how cold phases may align through the coming winter.
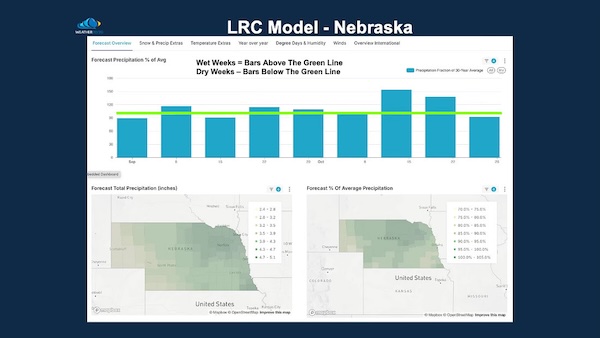
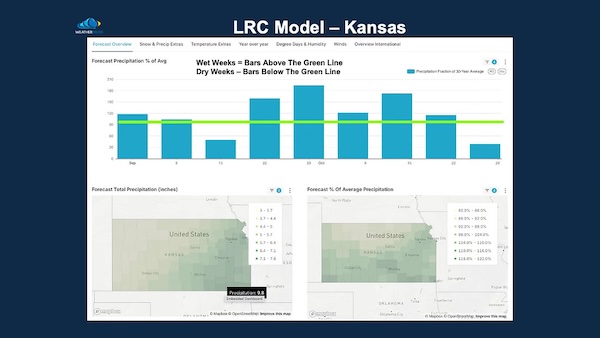
On the next few slides, we’ll take a state-by-state tour of the forecast. Each chart provides a week-by-week rainfall analysis with the wet weeks appearing above the green line and the likely dry weeks falling below the green line. These charts do more than just show rain chances, they visually display the phases of this year’s LRC in action. Remember, these forecasts are generated from data going back to last October, when this pattern first set up, and are projected forward using the LRC model. What you’ll see is the same cycling pattern that has already been verified in severe weather and tropical forecasts, now applied to guide harvest planning and operational decisions at the state level.


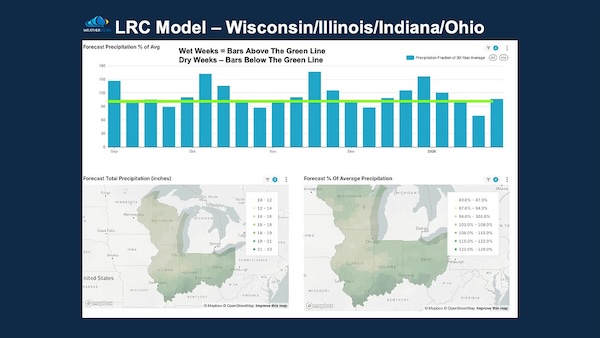
The outlook is clear, Phase 1’s return in late September through early October carries the highest risk for wetter, stormier conditions just as harvest is accelerating. Planning ahead now will pay dividends when that window arrives. To learn more about Weather 20/20s solutions, click HERE.