
Gary Lezak and his team at Weather 20/20 have done an amazing job this year! When everybody else in the industry was forecasting that the drought was going to spread and take a deeper bite, I was calling and checking with Gary, and he was assuring me that the drought was going to lose its grip and for the most part, the corn belt was going to see more rains than they have in several years. Some might want to argue that Gary and his team just got lucky this year, but I don’t think so, as he is explaining all along the way the method-for-his-madness. Bottom line, Gary Lezak and Weather 20/20 have quickly become my go-to for US weather forecasting. If you want to try it out or to play around with it for a while to see for yourself, Click HERE
“Our First Hurricane Is Likely Within 10 Days – Plus a Long-Range Outlook Through Winter”
In this report, we’ll break down the increasing tropical activity now developing in the Atlantic and why the first hurricane of the season is likely within the next 10 days — right on schedule according to the LRC. Then, we’ll take things a step further with an experimental long-range outlook through winter, offering insights that only the Lezak Recurring Cycle can provide.
Whether you’re planning for agriculture, energy, logistics, or just want to stay ahead of significant weather events — this information and forecast data will give you a clearer, longer view than anything else out there.

As you can see on the slide above, Tropical Storm Dexter formed almost exactly 41 days after Tropical Storm Andrea. This year’s cycling pattern has been centered on ~41 days. In our predictions, we had an 84% probability of a system forming this week, or six weeks from now. So, we will likely have another one near this same location around the middle of September.
While Tropical Storm Dexter poses no threat to land, we are growing increasingly confident that a hurricane is likely to form within the next 10 days. And yes — it’s right on schedule:
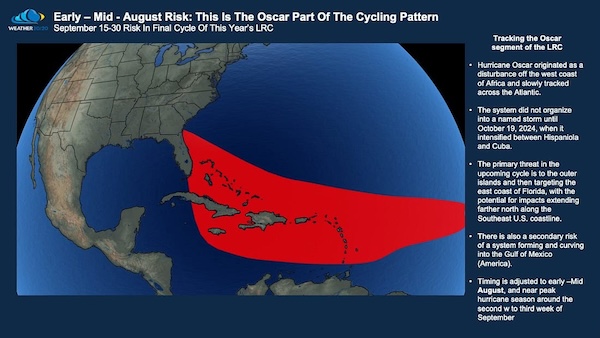

These two predictions are not guesses. They are directly tied to “weather seeds” we identified last fall, using the Lezak Recurring Cycle (LRC). When one or both of these systems develop into named storms — and we believe they will — we’ll be able to say with confidence: these were 10-month forecasts.
“They” will say, “Impossible.” But we know the truth: it’s the exact opposite of what ‘they’ think.
The GFS and European A.I. models are now beginning to align on the development of tropical systems, though they continue to show varying tracks and intensities. This morning’s data — shown below — highlights the increasing probability of hurricane formation within the next 10-15 days.

While the global models shift every six hours, offering a new solution with each run, our confidence remains steady.
We’ve been forecasting — for months — that one or two tropical systems will develop during this upcoming two- to three-week stretch. These date windows aren’t based on model hype, but on recurring atmospheric signals we first identified last fall.
We are now entering those windows. And when these systems organize — potentially into dangerous named storms — we’ll once again demonstrate that predicting 8 to 10 months in advance is not only possible… it’s already happening.
Two Main Phases of the 2024–2025 LRC: Critical to This Growing Season
Throughout the past year, two dominant and repeating phases of the LRC have shaped the rainfall patterns across the Agriculture Belt. These phases have impacted everything from planting delays to yield expectations, and the data behind them shows a clear, predictable structure.

Phase 1: The Wetter, Southern-Focused Stretch
- In each cycle, Phase 1 has featured a storm track dipping into the Southwest U.S., bringing energy across the southern and central Plains.
- This has resulted in above-average rainfall, especially for Kansas City and Des Moines, with more limited impact to the north (Fargo).
- These wetter windows lasted 2 to 3 weeks and repeatedly provided critical precipitation boosts.
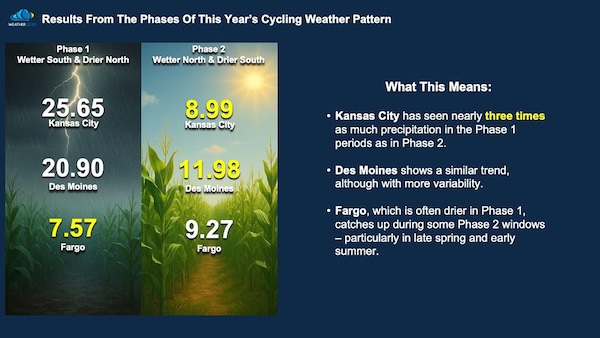
Phase 1 Rainfall Totals (through August 4):
- Kansas City: 25.65″
- Des Moines: 20.90″
- Fargo: 7.57″
These periods helped sustain crop development across large portions of the Corn Belt, especially during key growth stages in July.
Phase 2: The Drier, Northern-Shifted Pattern
- In contrast, Phase 2 featured reduced storm energy for the southern and central Plains, with storm systems either shifting north or weakening.
- These periods also lasted around 2 to 3 weeks and have been consistently drier — with exceptions farther north where Fargo occasionally benefited.
Phase 2 Rainfall Totals (through August 4):
- Kansas City: 8.99″
- Des Moines: 11.98″
- Fargo: 9.27″ – Phase 2 has actually been the slightly wetter phase for the northern plains region.
These drier stretches have aligned with heat spikes, lower dew points, and stress on crops, particularly when coinciding with pollination and grain fill windows.
Why This Matters Now
We are entering the final full cycle of this year’s pattern in the next few weeks. Based on our analysis, Phase 1 returns around August 14–September 5, offering one more opportunity for meaningful rainfall. After that, Phase 2 resumes and may close out the growing season with a drying trend — especially south of I-80. It also returns one more time near the end of September and October before the new LRC evolves, or just as it is evolving. It may be a wet ending to this year’s pattern, and it could affect harvest.
This repeatable structure isn’t guesswork. It’s based on a pattern that locked in last October, and it’s been driving the weather ever since.
If you’re in agriculture, this is where the LRC shines. It’s not about vague seasonal outlooks — it’s about knowing which two to three-week windows will deliver, and which won’t.

This map shows the 500 mb flow, around 18,000 feet above us. This was valid just a day ago on August 4, 2025. The jet stream is way up north as we are now at the peak of summer!
What happened to the heat wave creating machine, the anticyclone? It has weakened considerably and shifted over northwestern Mexico. Remember the part of the pattern that produced the higher heat will cycle back through one more time before fall arrives.

The Euro A.I. model shows widespread 2”+ rainfall from northwest Missouri north to the Canada border in the next 15-days.
Looking Ahead: An Experimental Glimpse Into the LRC Through March
Let’s take a bold, experimental look at what the current LRC suggests through next March. While we know a new LRC pattern sets up each October and November, the final few cycles of the existing pattern often offer valuable hints of what may return, especially early in the next cycle.
This is not the finalized winter forecast, but rather a testbed for applying what we’ve already observed to what may come.
Below is a chart we’ve created to preview potential snowfall patterns across Iowa, one of the key agricultural regions we monitor closely.
If this kind of long-range insight is helpful to you, let us know — we’re considering integrating these experimental extended outlooks into the Weather 20/20 Dashboard, many of you are already using.
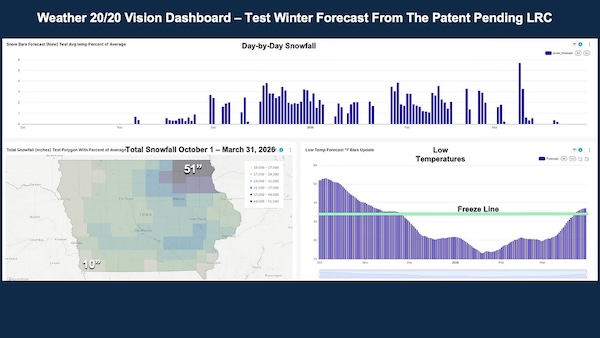
This chart above shows the predictions through next March. The top chart shows the day-by-day snow forecast for all of Iowa counties compiled together. The map on the lower left shows the snow forecast totals, and the one on the bottom right shows the low temperature forecast day-by day.
Here is the outlook for the month of September as we move from cycle 8 into the final cycle of this year’s weather pattern next month.


In Conclusion
As we move deeper into August, we hope this Weather 20/20 Intelligence Report has provided you with valuable insight— whether you’re tracking tropical threats, monitoring rainfall for your crops, or beginning to think ahead to winter planning.
We are now just two months away from the emergence of the next LRC pattern, which will begin evolving in October and November. Until then, we’ll continue to analyze the final cycles of this year’s pattern, track the accuracy of our long-range forecasts, and explore how we can expand tools like the Weather 20/20 Dashboard to deliver even more meaningful guidance to you.
We encourage your feedback, your questions, and your curiosity. If there’s something you’d like to see more of let us know. You are part of this journey as we continue to prove that long-range forecasting isn’t just possible — it’s powerful. Again, if you want to try it out or to play around with it for a while, Click HERE