It looks like an unusual winter is on the horizon. For the first time in seven years, the National Oceanic and Atmospheric Administration (NOAA) has predicted a “strong” El Niño event in the coming months. During El Niño, the prevailing winds near the equator in the Pacific relax. Surface waters in the central and eastern Pacific warm up. A major hotspot of tropical rainfall and convection (rising air) develops over the warm waters. Because of the Pacific Ocean’s tremendous size, disturbances there can lead to climate disturbances around the globe.
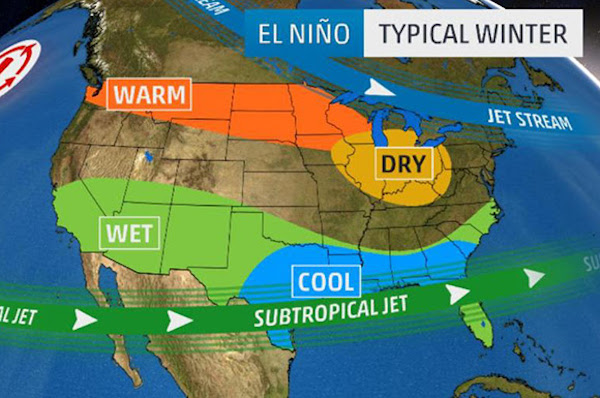
The last strong El Niño, which was one of the strongest in known history, was in 2015/16. It continues to hold the record as the warmest winter for the U.S. mainland. Extreme storms accompanied the altered climate, and in January 2016, a deadly blizzard buried the East Coast in dozens of inches of snow. While experts can’t predict the impacts of the upcoming El Niño winter, several weather patterns are most likely to emerge. El Niño typically brings cool and wet winter conditions to the Southern U.S., from Southern California through the Southeast. Drier-than-average conditions are typical for the Pacific Northwest and Ohio Valley region. The Northern tier of the U.S. tends to be warmer than average. Per NOAA’s most recent ENSO Outlook, these conditions are expected to last until around January to March 2024, and there is now a 71% chance that the event peaks as a strong El Niño winter. In case you are wondering… in 2016 US corn growers produced a record crop, the first-ever US crop over +15.1 billion bushels, up +11% from 2015.
The benchmark for a strong El Niño winter has been that experienced during the winter of 1997-98 and 2015-16. With most in the row-crop industry desperately trying to predict how the weather pattern will develop and play out during the upcoming winter and next growing season, I thought including some information about how the two most recent and strongest have played out.
West Coast Differences: El Nino winters favor above-average precipitation in the West, but not all seasons are created alike. California was a state divided as the storm track from December 2015 through February 2016 brought plenty of rain and snow to the northern part of the state, while a general lack of rainfall and stagnant drought conditions were observed over southern sections.
Crazy Alaskan Weather: Alaska experienced a very strange winter in 2015-16, as it was one of the warmest on record for The Last Frontier, and it was among the driest and least snowy as well. Of course, this is similar to what happened in the winter of 1997-98, but only slightly. For example, in 199-98, winter at Anchorage had an average temperature of 19.3 degrees, the 22nd warmest on record. Compare that to 2015-16 which came in as the second warmest at just over 26 degrees.
Difference in the South: One of the characteristics of strong El Niño winters is for the South to remain cooler than average. However, during the winter of 2015-16, the U.S. was anything but cool, including across the South. Usually, an active southern branch of the jet stream dips southward, bringing blasts of cold air to the South. Though this pattern was prevalent for parts of 2015-16 winter, it was offset, at times, by substantial high pressure off the Southeast coast. For example, Jackson, Mississippi had a top 15 warmest winter on record from 2015-16, with an average temperature of 52.5 degrees. The 1997-98 El Nino winter was much closer to average, boasting an average temperature of just 48 degrees.
Warmth in the North: As predicted, warmer-than-average temperatures were felt across the northern tier of states. Just like in 1997-98, the most above-normal warmth was in a swath from the northern Plains to the Great Lakes. For example, only 0.9 degrees separates the average temperature at Fargo, North Dakota between the 1997-98 and 2015-16 winters. The former was the fourth warmest on record, while the latter was close behind as the sixth warmest.
What About US Corn Yields?
- 1998 Corn for grain production was up +18%, with the average US corn yield reported at 111 bushels per acre, up +13 bushels from 1997.
- 2016 U.S. corn growers produced 15.1 billion bushels, up +11% from 2015. Corn yield in the US was estimated at 174.6 bushels per acre, +6.2 bushels above the previous year’s average yield.
Bottom-line, no two El Niño’s are created equal. While long-range forecasters can look to El Niño and La Niña patterns from the past for hints about the future, there are simply too many factors and unknowns that will come into play moving forward to be decidedly accurate. Wish I had more definitive answers, but I don’t. I continue to take a “wait-and-see” approach… (Source: Weather Channel)