The U.S. has historically been one of the largest exporter of agricultural crops but increased competition threatens its global standing, according to a new report from the United States Department of Agriculture’s Economic Research Service (ERS). Export shares and exports-to-production ratios indicate the US continues to be the top exporter of corn, tree nuts, and cotton, while other competitors have penetrated the global wheat and soybean markets.
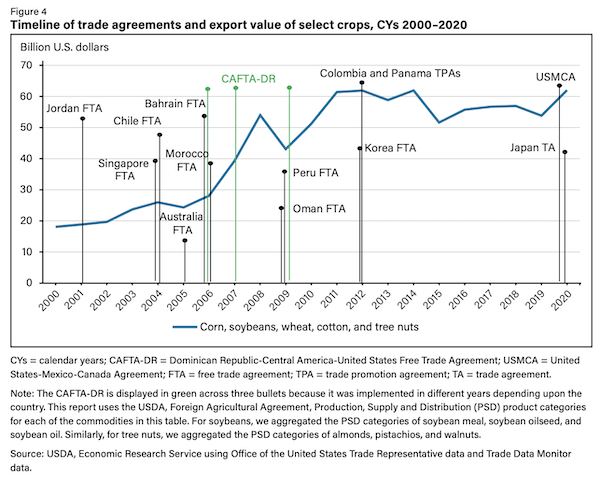
USDA’s study highlights US export competitiveness in five major commodity markets: corn, soybeans (including derivative products), wheat (including processed wheat products), tree nuts, and cotton exports. These commodity groups represent the top five US crop exports in terms of value. The United States’ involvement in trade agreements, particularly with emerging markets, contributes to its export competitiveness. However, from 2012 through 2020, the United States did not establish any new free trade agreements (FTAs), potentially limiting U.S. export opportunities in some emerging markets while other competitors signed multiple FTAs during that same period. Below are some of the details regarding corn, soybeans, and wheat markets. The full report is HERE.

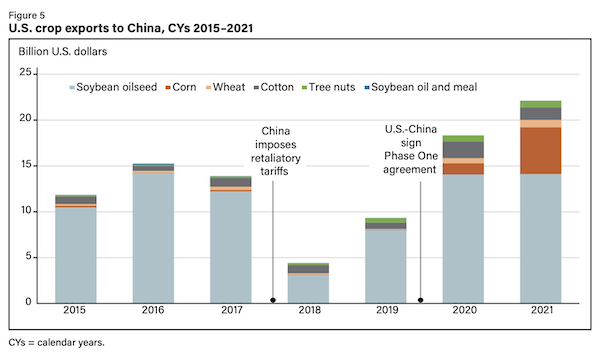

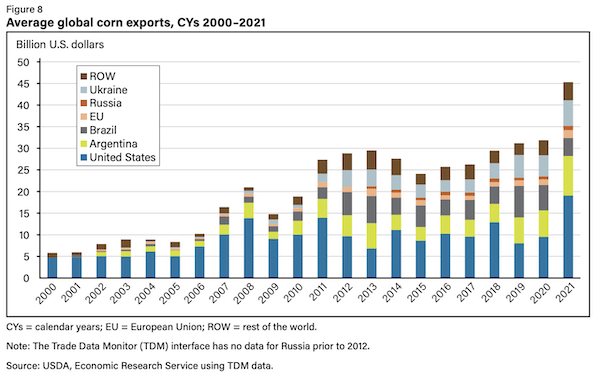
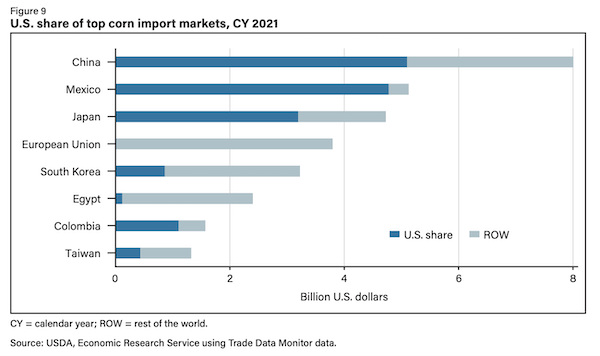
Corn: Corn has been the leading U.S. crop in terms of production and acreage and is second only to soybeans in terms of export value. The U.S. also remains the world leader in corn exports, though competition from Brazil, Argentina, and Ukraine has increased in the last decade. U.S. corn exports were valued at over $9.2 billion in calendar year (CY) 2020 and $18.7 billion in CY 2021. The +100% increase over 2020 is partly attributed to strong feed demand in China and the Phase One agreement. U.S. corn represents a large share of the corn imported by China, Japan, South Korea, Mexico, and Colombia—all countries with a U.S. trade agreement in place.
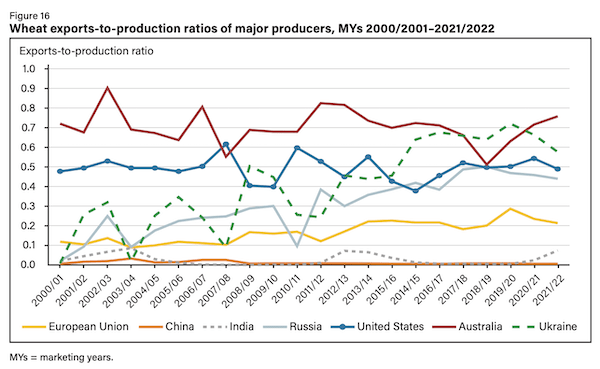
Compared with other major exporters, the United States maintains a relatively low exports-to-production ratio for corn. Around 15% of production is exported, while at least two-thirds of production is destined for domestic ethanol and livestock production. The ratio declined between MYs 2007/2008–2013/2014 with the expansion of ethanol production, while partially rebounding since. Ukraine and Brazil were the two main entrants into the global corn market over the last 10 years
Large corn farms in Brazil, Argentina, and elsewhere are comparable with those in the United States; however, yields, land costs, transportation, and marketing differ. Farms in the U.S. Midwestern Corn Belt, or Heartland region, achieve the highest yields and thus the lowest cost per bushel compared with the Argentine Northern Heartland and the Paraná region in Brazil. Lower transportation costs also drive U.S. competitiveness. However, including the (opportunity) costs of land reveals a Brazilian advantage, with new areas opened to agriculture in recent decades at low—or externalized—costs.
Soybeans: In the United States, soybeans are the highest value agricultural commodity export, grossing more than all corn, wheat, rice, and cotton exports combined in 2020. Soybean alternates with corn as the primary crop on much U.S. farmland, with soybean acreage increasing over the past 25 years in part due to yield improvements and low production costs. Soybeans comprise approximately 90% of U.S. oilseed production .
Since the 1990s, production in South America has expanded to meet growing global demand—much of it
on deforested land in the Brazilian Amazon, Cerrado, and other landscapes cleared for agriculture. Brazil and Argentina, along with the United States, have been among the top producers of soybean oilseed, soymeal, and oil.
The United States and Brazil account for most soybean oilseed exports, capturing over 80% of export shares in 2021. In terms of value, Brazil was the largest exporter from 2007 to 2018 as its export shares steadily increased, surpassing the United States in the global arena. Although Argentina lags behind Brazil and the U.S. in soybean oilseed exports, the country has been the largest exporter, in terms of value, of soybean meal and oil. In 2021, Argentinian soybean oil exports were valued at $7.1 billion—more than three times larger than soybean oil exports from Brazil and eight times larger than exports from the United States. Similarly, Argentinian soybean meal exports reached $12.11 billion in 2021, followed by Brazil and the United States.
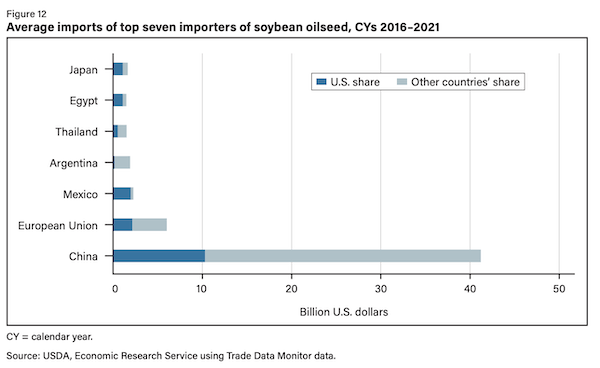
The largest markets for soybean oilseed include China, which has imported four times the value of any other U.S. trading partner over the last 5 years—followed by the EU, Mexico, Argentina, several East Asian nations (Japan, Indonesia, the Philippines, Taiwan, Thailand, South Korea), and Egypt. China has remained the top destination for U.S. soybean oilseed exports; however, the United States has accounted for a larger market share of imports from Mexico and Japan, longtime partners with whom new trade agreements were negotiated in 2020 (USMCA and USJTA).
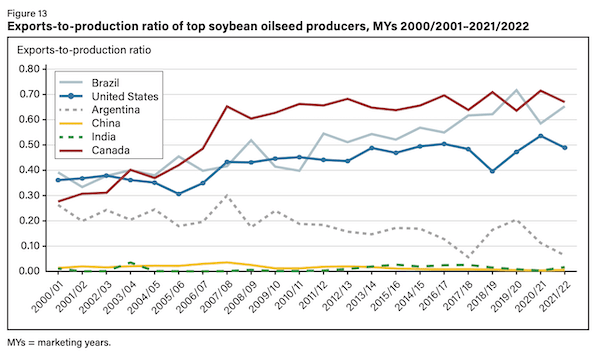
From 2000 to 2021, the United States remained both a major exporter and producer of soybean oilseed while increasing its average export propensity (exports-to-production ratio) from around 0.49 to 0.60. Meanwhile, Brazil has produced soybeans mainly for export, with ratios ranging from 0.40 to 0.72 and trending upward in the last decade. Conversely, Argentina’s soybean export propensity has trended downward since MY 2007/2008. This can be attributed to Argentina processing soybean oilseed into soybean meal and oil.

Wheat: The value of global wheat8 exports has fluctuated over the last 20 years, partly because of economic events and trade policies. In 2018, China imposed a 25%tariff on U.S. wheat, and U.S. wheat export value declined by 10.5 percent relative to 2017. Analysis found that China’s retaliatory tariffs on U.S. wheat imports resulted in annualized losses of -$308 million from mid-2018 through 2019.
The six largest wheat exporters by value are Australia, Canada, the EU, Russia, Ukraine, and the United States. In 2021, wheat exports from these countries accounted for more than 70 percent of all exported wheat. The United States’ current standing within this market has evolved, with its share of global wheat exports having decreased over time. In 2000, 40% of global wheat exports by value originated from the United States, and by 2021, this share declined to 12.4%.
The reduced export share was—in part—the result of downward trends in the area of wheat planted and production in the United States since the 1980s. This declining production is attributed to a variety of factors, including increased foreign competition that has decreased wheat farmers’ returns, a policy that allows for more flexible crop choices, and improved production of corn and soybeans due to greater genetic and technological advancements relative to wheat.
Competition from the EU, Russia, and Ukraine has contributed to the decline in U.S. wheat exports, even as wheat demand has steadily increased in developing countries where populations are increasing. Many of these markets have relied primarily on Russia and Ukraine for lower-cost wheat of varying quality levels. The most dramatic change in export shares occurred with Egypt, the largest importer of wheat in the world. In 2000, the United States was the major source of wheat for Egypt, and by 2020, U.S. exports to Egypt fell to less than 1% of the country’s total wheat imports. In 2021, Egypt primarily imported wheat from Russia (48%) and Ukraine (28%).
Exports-to-production ratios for the United States were fairly stable from MY 2000/2001 to MY 2006/2007, increasing from 2006/2007 to 2007/2008 and then sharply declining in 2008/2009 to 0.40. From 2010 to 2015, the United States’ propensity to export trended downward, reaching a low of 0.37 in 2015 in part due to U.S. wheat exports declining to 21.2 million metric tons. More recently, the U.S. propensity to export wheat slightly declined from 0.54 in 2020 to 0.49 in 2021. Australia had the highest export propensity in 2021 with a ratio of 0.76.