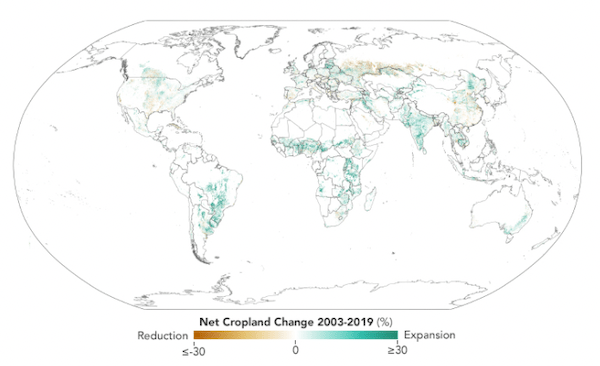
NASA Earth Observatory recently featured research on global cropland expansion as its Image of the Day. The new mapping from the Global Land Analysis & Discovery Lab (GLAD) at the University of Maryland show changes between 2003 and 2019 and are based on imagery collected by Landsat satellites.
According to the GLAD team analysis, the total land area covered by crops has increased by +9% since 2003, or about 400,000 square miles. That’s an area about the size of Egypt. Half of the new cropland replaced other natural vegetation such as grasslands or forests. The other half came from the recultivation of abandoned farmland or conversion of pastures.
“People have used satellites to map cropland extent before. What distinguishes this effort is that we are showing change over a long period of time,” said Peter Potapov, the co-director of GLAD and the lead author of the study. “We also do it in a way that is consistent across international borders so we can compare what is happening in different regions or countries in a meaningful way.” Most previous attempts to map and compare farmland relied on the compilation of local or regional data via methods and definitions that varied significantly.
With 204,600 square miles of new cropland, Africa added the most of any continent. South America followed with around 143,000 square miles of new cropland. Brazil accounted for the biggest increase there with a +77% expansion over 2003 cropland areas.Southwest Asia and Australia also saw increases, though much more modest ones.
In North America, Europe, and Southeast Asia, total cropland stayed roughly the same. However, some of these areas saw significant shifts in where farmland was located. In the United States, a trend toward new corn, wheat, and soybean plantings in Great Plains grasslands offset the abandonment of significant amounts of land in the eastern U.S. In China, farmland increased in arid areas of the west even as rapid urbanization and a growing aquaculture sector nibbled away at it around eastern cities and coastlines.
The researchers noted that Russia witnessed the largest reductions. The country began abandoning large amounts of farmland following the dissolution of the Soviet Union in the 1990s, when the government ended subsidies that had made it possible to raise crops on subpar land. The Baltic states of Lithuania, Latvia, and Estonia had the opposite experience. The breakup of the Soviet Union led to large increases in croplands as these states became more integrated into global markets.
The expansion looks different when accounting for population changes. The global population increased by 21% from 6.4 billion to 7.7 billion during the 2003-2019 period. As a result, global per-capita cropland area decreased by -10%. An increase in per-capita cropland area was observed only in South America, while it decreased in all other continents. The largest relative decrease of per-capita cropland area was observed in Southwest Asia (-19%). Southeast Asia had the smallest 2019 per-capita cropland area, whereas Australia and New Zealand had the largest.
By adding NASA data on the net primary productivity (NPP) of croplands, the researchers also estimated whether cultivated areas grew more or less productive over time. Net primary productivity is a measure of how much energy plants store through photosynthesis and is used as a proxy variable for analyzing crop productivity. Globally, this metric increased by +25% between 2003 and 2019. South America had the highest NPP increase (+88%) followed by Africa (+50%). The per-capita annual cropland NPP also increased (+3.5%) largely as a result of intensified agricultural land use. The full study is HERE.