In the 2023 edition of “America’s Farms and Ranches at a Glance,” the USDA’s Economic Research Service (ERS) finds that the majority of farming and ranching operations in the US during 2022 were still family-owned. What’s more, only around 26% had any debt. A “family farm” is of course one where the majority of the business is owned by the principal operator and persons related to them. While the number of non-family farms does continue to increase, they account for only about 2.7% of US farms in 2022, up from 2.1% in 2021.
I’ve included some other highlights from the report below. For the sake of reference, farm size is measured by gross cash farm income (GCFI), a measure of the farm’s revenue including sales of crops and livestock, government payments, and other farm-related income, including fees received by operators from production contracts. Most of the analysis in the report is based on a total sample of approximately 19,100 farms from the 2022 Agricultural Resource Management Survey (ARMS), an annual survey conducted by USDA, National Agricultural Statistics Service (NASS) and USDA, Economic Research Service (ERS). The full report is available HERE.
Small Family Farms Account for 88% of All US Farms
- Small family farms – defined as having gross cash farm income (CGFI) of less than $350,000 annually – operate on 46% of US agricultural land a account for 19% of the total value of production.
- Midsize family farms (GCFI between $350,000 and $999,999) accounted for 21% of agricultural land and 19% of the total value of production.
- Large-scale family farms, or those with GCFI of $1 million or more, accounted for 52% of the total value of production and 25% of agricultural land in 2022.
- In total, family farms accounted for just over 97% of total farms and nearly 90% of total production in 2022.
- “Nonfamily farms” accounted for the remaining percentage of farms (2.7%) and production (10.4%). Nonfamily farms vary widely in size, income, and ownership structure and include partnerships of unrelated persons, nonfamily corporations, and farms with a hired manager unrelated to the owners.
- Among nonfamily farms, 16% had a GCFI of $1 million or more. These large-scale nonfamily farms accounted for 89% of all nonfamily farms’ production.
Large-Scale Family Farms Dominate Production of Several Key Commodities
- Large-scale family farms accounted for a majority of the value of beef (50%), hogs (56%), cotton (65%), cash grains and soybeans (51%), dairy (76%), and specialty crops (65%) production in 2022. Small family farms produced the majority of hay (53%).
- Around 26% of the value of beef production occurred on small family farms. These farms often have cow/calf operations, while largescale family farms are more likely to operate feedlots.
- Compared to 2021, the value of hog production increased to 56% in 2022 from 35% in 2021 for large-scale family farms and decreased to 10% in from 35% previously for nonfamily farms.
- The value of production by nonfamily farms ranged from 5% for poultry and eggs and hay production to 19% for specialty crop production.
Small Family Farms are Mored Financially Vulnerable
- USDA uses “Operating Profit Margin” – the share of gross income that is profit – as one way to gauge a farm’s financial performance. An OPM of less than 10% is considered an indication of potentially more financial vulnerability.
- In 2022, between 52% and 79% of small family farms had an OPM in the high-risk zone (less than 10% OPM).
- Large farms in 2022 were most likely to have OPMs in the low-risk zone (OPM of at least 25%) at 51% and least likely to be in the high-risk zone at 27%.
- The share of farms in the medium-risk zone (OPM between 10% and 25%) ranged from 4% (retirement farms) to 26% (very large farms). For each farm type, the percentage of farms in the medium-risk zone was smaller than the share of high and low-risk farms.
- ERS notes that compared with 2021, the percentage of small family farms in the low-risk zone increased or remained the same in 2022. All other farm types showed a decline in the percentage of farms in the low-risk zone in 2022 relative to 2021. This could be due in part to the large increase in prices received compared to the smaller increase in input costs in 2022, resulting in record-high net farm income. However, these returns were not equally distributed across all commodities.
Only 26% of US Farms Held Any Debt in 2022
- Over half of each farm type reported loans owed to a commercial bank in 2022. Between 8% to 10% of farms with loans, depending on farm type, reported having a loan serviced by the USDA, Farm Service Agency.
- At 31% of farms with debt, small family farms that reported holding any debt were less likely to have a loan through the Farm Credit System compared to all other farm sizes. However, small family farms had the largest share (28%) receiving a loan through other lenders relative to large-scale family farms (21%) and nonfamily farms (18%).
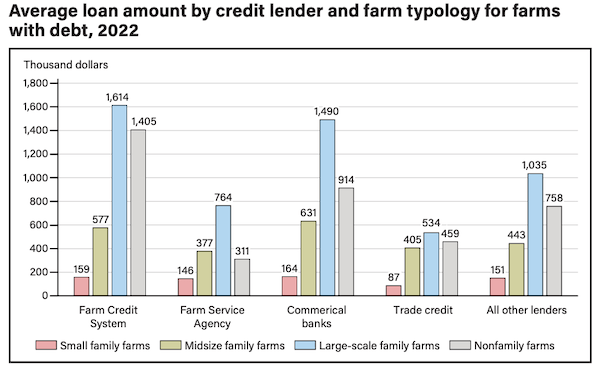
- For all credit lender types except trade credit lenders, large-scale family farms with loans had higher average loan amounts relative to small and midsize family farms. This is consistent with the fact that farming is capital-intensive and large-scale family farms account for the majority of U.S. agricultural production.
- Large-scale family farms had the largest percentage (76%) of farms with loans relative to all other farm sizes.
Median Total Income of Family Farms was Greater Than the Median of All US Households
- Median total farm household annual income varied across farm types, with very large family farms having the largest median household income at more than $1 million, compared with low-sales family farms at $70,200. Low-sales and retirement farms ($71,837) had median household incomes below all U.S. households ($74,580) and also below U.S. households with self-employment income ($97,856).
- Median and average total household income increased for all farm types except moderate and midsize family farms from 2021 to 2022.
- The percentage of family farms with income below the U.S. median income level varied from 10.8% to 53.0%, depending on the type of farm.
- Most family farms also have higher wealth than the median household in the United States. The value of land comprises the largest share of most farm households’ wealth.
- Operators of small family farms—especially off-farm-occupation and low-sales farms—often reported losses from farming. In 2022, the average farm income among off-farm-occupation farms was -$2,943, and among low-sales farms, it was -$2,976.
- About 84% of all U.S. farm households earn the majority of their total household income from off-farm sources and often use off-farm income to cover some portion of farm expenses. As farm size increases, the percentage of households relying on off-farm income decreases.