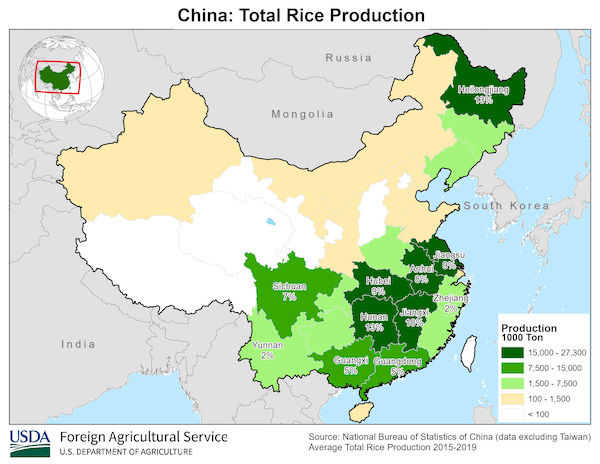
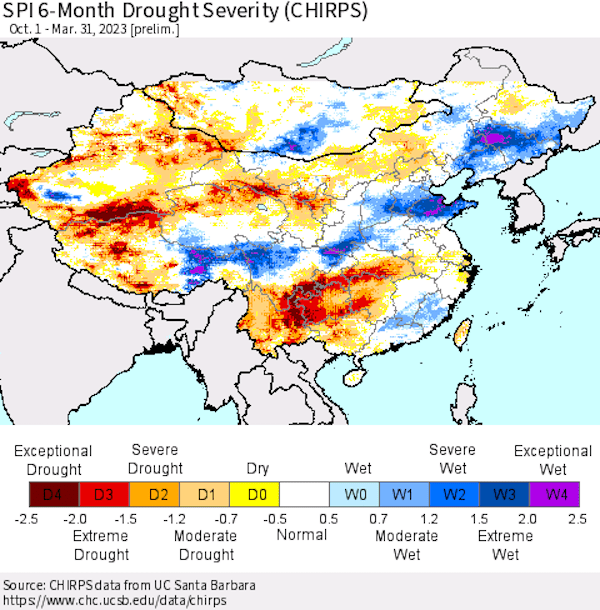
Talk of a global rice shortage has recently hit mainstream media with the press latching onto a report from Fitch Solutions. According to Fitch analysts, the global rice market in 2023 is set to log its “largest shortfall in two decades.” The report points to the war in Ukraine as well as adverse weather, particularly heat and drought in China and severe flooding in Pakistan. In fact, CNBC recently ran an article titled, “Global rice shortage is set to be the biggest in 20 years“.
Fitch estimates a global production shortfall of -8.7 million metric tons (MMT) in 2022/23, which is slightly more optimistic than USDA’s estimate for a deficit of -9.34 MMT. Fitch points out that this would mark the largest global rice deficit since 2003/04 when the shortfall reached -18.6 MMT. While that is true, it is worth pointing out that global ending stocks are significantly higher than they were in 2003/04, which were around 82 MMT versus the 171.4 MMT estimated by USDA for 2022/23.
Things look a little tighter when you strip out China’s supplies. USDA estimates global ending stocks less China at 64.47 MMT, meaning China, the world’s largest rice producer, holds the majority of the world’s stockpiles at nearly 107 MMT. In 2003/04, global stocks less China were even tighter at just over 38 MMT.
For the sake of comparison, China’s production in 2003/04 was way down at just around 112 MMT, the lowest since 1981/82. The country’s production rebounded slowly and ending stocks continued to fall for three more years, hitting just under 36 MMT in 2006/07, also the lowest since 1981/82.
USDA is forecasting a drop in Chinese production this year to 145.95 MMT versus nearly 149 MMT in 2021/22, a drop of approximately -3 MMT. Other big declines include Pakistan’s production, which is expected to drop by at least -2.7 MMT, and the United States, with production sliding nearly -1 MMT, according to the USDA’s April WASDE. By contrast, output in India, the world’s second-largest rice producer and typically the third-largest exporter, is currently estimated by USDA at 132.00, up from 129.5 MMT last year.
Based on USDA’s data, the global stocks-to-use ratio for rice in 2022/23 will be right at 33% versus 35% in 2021/22 and 37.2% in 2020/21. Taking another look back, the stocks-to-use ratio was 20% in 2003/04. Rice futures prices peaked around $11 in early 2004.
Interestingly, the global rice stocks-to-use ratio continued falling for another three years – along with China’s ending stocks decline – before hitting 18.2% in 2006/07. Global rice prices rose to record highs in spring of 2008, tripling from November 2007 to late April 2008 when futures touched $21. However, this was not necessarily a result of tight supplies. In fact, global rice production in 2007/08 was the highest on record to that point with even higher production and ending stocks forecast for the year ahead.
The rapid increase in rice prices that occurred in late 2007 and early 2008 was primarily a result of trade restrictions implemented by Vietnam (typically the second largest rice exporter) and India in October 2007, followed by additional exporters in early 2008. Many analysts, including USDA, blame a combination of “panic buying” and a shift of funds into commodities that added to price volatility.
Those upward catalysts were underpinned by longer-term shifts, including rising incomes in Asia, a massive increase in biofuels production, and the elimination of excess global stocks. It’s worth noting that rice prices actually trailed a run-up in corn, soybeans, and wheat prices that occurred from 2006-2008. From January 2006 to October 2007, global corn and wheat prices more than doubled, while rice prices increased just +12%.
Fitch in their forecast also noted the potential for even higher demand for rice as high prices drive demand away from wheat and corn. Fitch estimates that the global rice market should return to near normal in 2023-24 and projects that the prices of rice could drop almost -10% to $15.50 per hundredweight in 2024. (Sources: USD, Fitch Solutions, Southern Ag)


